Categories
Analytics Litigation strategy Virus exclusions

Insurers without virus exclusions are losing their motions to dismiss

Author: Tom Baker Date: 10.07.20

Insurers without virus exclusions are losing their motions to dismiss

Policyholders are winning motions to dismiss in cases without virus exclusions.

We are working on a graphic to depict the following finding in dynamic fashion (so that it updates automatically as our data develop), but in the meantime here is a significant finding that hasn’t yet been reported.

Of the seven cases in which a merits-based motion to dismiss has been denied, four involve insurance policies without any virus exclusion, one involves the Hartford’s Endorsement for Limited Fungi, Bacteria, or Virus Coverage (which contains a virus exclusion that could be read to apply only to losses involving defective materials), and two have virus exclusions that apply to sickness or disease.

By contrast, of the eighteen cases in which a court has granted a merits-based motion to dismiss, only two don’t have virus exclusions.

This matters, among other reasons because the presence of a virus exclusion inhibits policyholders from pleading their cases in ways that would help them meet the requirement that their business income losses result from “physical loss of or damage to” the premises in question.

Bottom line: insurers are winning, overwhelmingly, when their policies have virus exclusions.  But they are losing, at least at the motion to dismiss stage, when their policies do not have virus exclusions.

Categories
Analytics

Behind the scenes at Lex Machina

Author: Date: 09.30.20

Behind the scenes at Lex Machina

Great conversation today with Carla Rydholm and Ron Porter at Lex Machina, comparing notes on identifying Covid Coverage Litigation cases.  Carla is head of product, and Ron is the lawyer behind their new business interruption and Covid 19 case tags. Excellent opportunity to peek under the hood at Lex Machina (more rules-based algorithms and less machine learning than I thought).  And further demonstration of their commitment to building a great database, not just delivering documents.  (I still can’t understand why Bloomberg Law charges the first person who asks for a document and then gives it away to any subsequent subscriber.  The first person who requests the document is the one who’s doing the hard work of deciding that the document matters!)  Plus, it’s nice to talk to people who appreciate how much effort, and how much judgment, goes into creating a bespoke database.

Categories
Analytics

Using CCLT data in the fight over immunity legislation

Author: Tom Baker Date: 09.27.20

Using CCLT data in the fight over immunity legislation

John Witt from Yale Law School and his student Josh Czaczkes are using the CCLT insurance policy database to see whether general liability and businessowners liability policies regularly contain virus exclusions.  Their preliminary finding is “mostly not,” suggesting that the main beneficiaries of Covid immunity legislation may be insurers, not small business.  You can find their preliminary results here.  I’m delighted to see the CCLT database used in this way!


Categories
Analytics Business Income Cases

WSJ Uses CCLT!

Author: Tom Baker Date: 09.03.20

WSJ Uses CCLT!

CCLT has become a trusted source for information about Covid-related insurance coverage litigation, as demonstrated in Leslie Scism’s latest piece in the Wall Street Journal.  The link is here.  The WSJ cites CCLT’s weekly filing statistics, cumulative cases, and our tracking of the judicial decisions to date.  To our regret, we were not aware that policyholders had notched an additional victory in the ongoing motion to dismiss battle in mid-August.  See Optical Services v. Franklin Mutual Insurance Company, No. BER-L-3681-20 (NJ Superior Court, Bergen County) (transcript released 8/28/2020).  Our real-time tracking of judicial decisions will be released soon.

Categories
Analytics Business Income Cases Nat Cat comparisons

Learning from NatCats: Is the onslaught of cases yet to come?

Author: Sean Bissey Date: 07.14.20

Learning from NatCats:  Is the onslaught of cases yet to come?

In earlier posts I described how Lex Machina’s insurance analytics platform allows us to track the filing of business income lawsuits over time and how the NatCat and Covid-19 cases appear as spikes in that timeline.  Today’s chart shows how the NatCat suits rolled out over time.  In each case, the suits trickled in at first, and only reached the peak rate of filing one or two years after the NatCat event.  If the Covid-19 business income lawsuits filing rates are anything like that, we won’t see the peak until at least late 2021.


Categories
Analytics Business Income Cases Nat Cat comparisons

Updated Q2 data comparing Covid 19 Business Interruption Litigation to Earlier Nat Cat litigation

Author: Sean Bissey Date: 07.10.20

Updated Q2 data comparing Covid 19 Business Interruption Litigation to Earlier Nat Cat litigation

Now that we have the full Q2 case filings from Lex Machina, I updated the chart I posted on June 26, which shows the business interruption insurance coverage cases filed in federal courts since 2009 (the first year for which Lex Machina has the full set of cases filed in federal court).  The difference between the Covid-19 case filings and the earlier Nat Cat filings is now even more stark. The Covid-19 bump is five times the fiver year trailing average, and the excess over the average for the Covid-19 filings is over twice the total of the excess filings during the quarters dominated by the earlier Nat Cat filings.

Categories
Analytics

Industries leading the Covid-19 coverage litigation pack

Author: Sager Mortizky Date: 07.08.20

Industries leading the Covid-19 coverage litigation pack

There are well over 600 covid coverage lawsuits in the CCLT database, and that number is rising daily. The CCLT team has classified the suits according to the industry of the lead policyholders in each case.  The graph shows the total number of cases by industry as of June 26 (keeping in mind that our data for state court suits is on a two-week delay) for the top five industries and for all other industries combined.

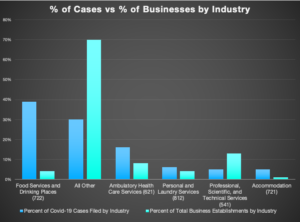
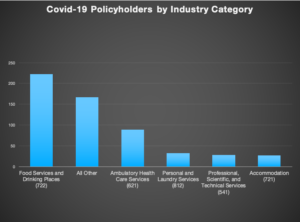
Food Services and Drinking Places are leading the pack, with 40% of the cases, followed by Ambulatory Health Care Services with 16% of of the cases.  Most of the ambulatory health services plaintiffs are dentist offices (59 out of the 87 cases in that category). The share of cases represented by other industries quickly falls off after these two.

The chart below helps put these numbers in perspective.  The blue bars show the share of covid coverage suits involving these industries.  The orange bars show these industries’ share of all businesses in the U.S. (drawn from data at https://www.naics.com/). Once again, Food Services and Drinking Places stand out. Representing just 4% of total business establishments, these business have brought 40% of the coverage lawsuits.

Categories
Analytics

Nat Cat Business Interruption Claims: How does Covid-19 compare?

Author: Sean Bissey Date: 06.26.20

Nat Cat Business Interruption Claims: How does Covid-19 compare?

To compare the impact of Covid-19 with that of other recent catastrophic claim events within the property insurance industry, I analyzed business interruption claims in federal courts from 2009 through the present day using LexMachina’s Insurance Litigation Analytics.  My results appear in the graph below.

BI claims over time showing nat cat and Covid 19 spikes

This graph shows (a) the number of business interruption cases filed in or removed to federal courts, by quarter, during the years 2009-2020 and, (b) beginning in 2014, the rolling, previous five-year average of business interruption court cases.  (I selected 2009 for the initial year because that is the earliest year for which Lex Machina has the complete universe of federal cases.)

As the graph shows, previous natural disasters produced noticeable spikes in the number of business interruption claims in federal court. But none of these spikes is as dramatic as that for Covid-19.  Covid-19 has already produced more “excess” business interruption cases than Hurricanes Ike, Irma, and Harvey and Superstorm Sandy combined. Notably, the graph shows that filings typically do not reach their peak until at least a year after the catastrophic event. Hurricane Ike, for example, made landfall in September 2008. Of the 180 federal cases filed, 33 cases were opened in 2008/2009, while 150 were opened in 2010/2011. This could indicate that we are just seeing the first wave of these business interruption claims. This is especially worrying considering Q2 filings of business interruption claims are already more than five times the normal level.

Unlike previous natural disasters, the impact of COVID-19 is not limited by a regional zone of impact.  This national character is reflected in the federal case filings.  The top five courts for Covid coverage cases range from the E.D.Pa. to W.D.Wash.  By contrast, Hurricane Ike caused spikes in business interruption claims in the S.D.Tex. while Superstorm Sandy caused a sharp rise in these case type filing in the federal district courts of New York, consistent with the geographic impact of those storms.