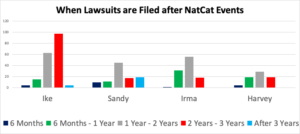
In earlier posts I described how Lex Machina’s insurance analytics platform allows us to track the filing of business income lawsuits over time and how the NatCat and Covid-19 cases appear as spikes in that timeline. Today’s chart shows how the NatCat suits rolled out over time. In each case, the suits trickled in at first, and only reached the peak rate of filing one or two years after the NatCat event. If the Covid-19 business income lawsuits filing rates are anything like that, we won’t see the peak until at least late 2021.


