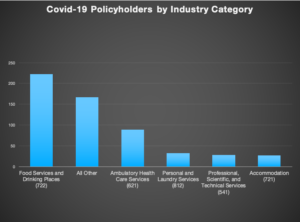
There are well over 600 covid coverage lawsuits in the CCLT database, and that number is rising daily. The CCLT team has classified the suits according to the industry of the lead policyholders in each case. The graph shows the total number of cases by industry as of June 26 (keeping in mind that our data for state court suits is on a two-week delay) for the top five industries and for all other industries combined.
 Food Services and Drinking Places are leading the pack, with 40% of the cases, followed by Ambulatory Health Care Services with 16% of of the cases. Most of the ambulatory health services plaintiffs are dentist offices (59 out of the 87 cases in that category). The share of cases represented by other industries quickly falls off after these two.
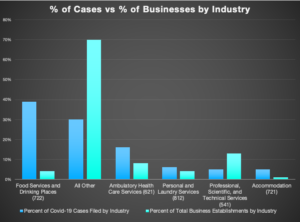
The chart below helps put these numbers in perspective. The blue bars show the share of covid coverage suits involving these industries. The orange bars show these industries’ share of all businesses in the U.S. (drawn from data at https://www.naics.com/). Once again, Food Services and Drinking Places stand out. Representing just 4% of total business establishments, these business have brought 40% of the coverage lawsuits.


